 Statversity
Statistics for people who are not statisticians.
Statversity is a desktop app for students, educators, and researchers. Open your data, answer a few questions, and get the right test. All results are explained in plain English and written up in APA style.
Mac (Apple Silicon) and Windows. One-time purchase, every future version included.
- CSV
- Excel
- SPSS (.sav)
- Stata (.dta)
- SAS
- Qualtrics Survey Files (.qsf)
Qualtrics users: add your survey file (.qsf), and Statversity fills in the full wording of every question, organizes the variables into survey blocks, and the names of the answer choices. Select the correct answer so Statversity can do the grading for you!
Three steps from file to paper.
Upload your data.
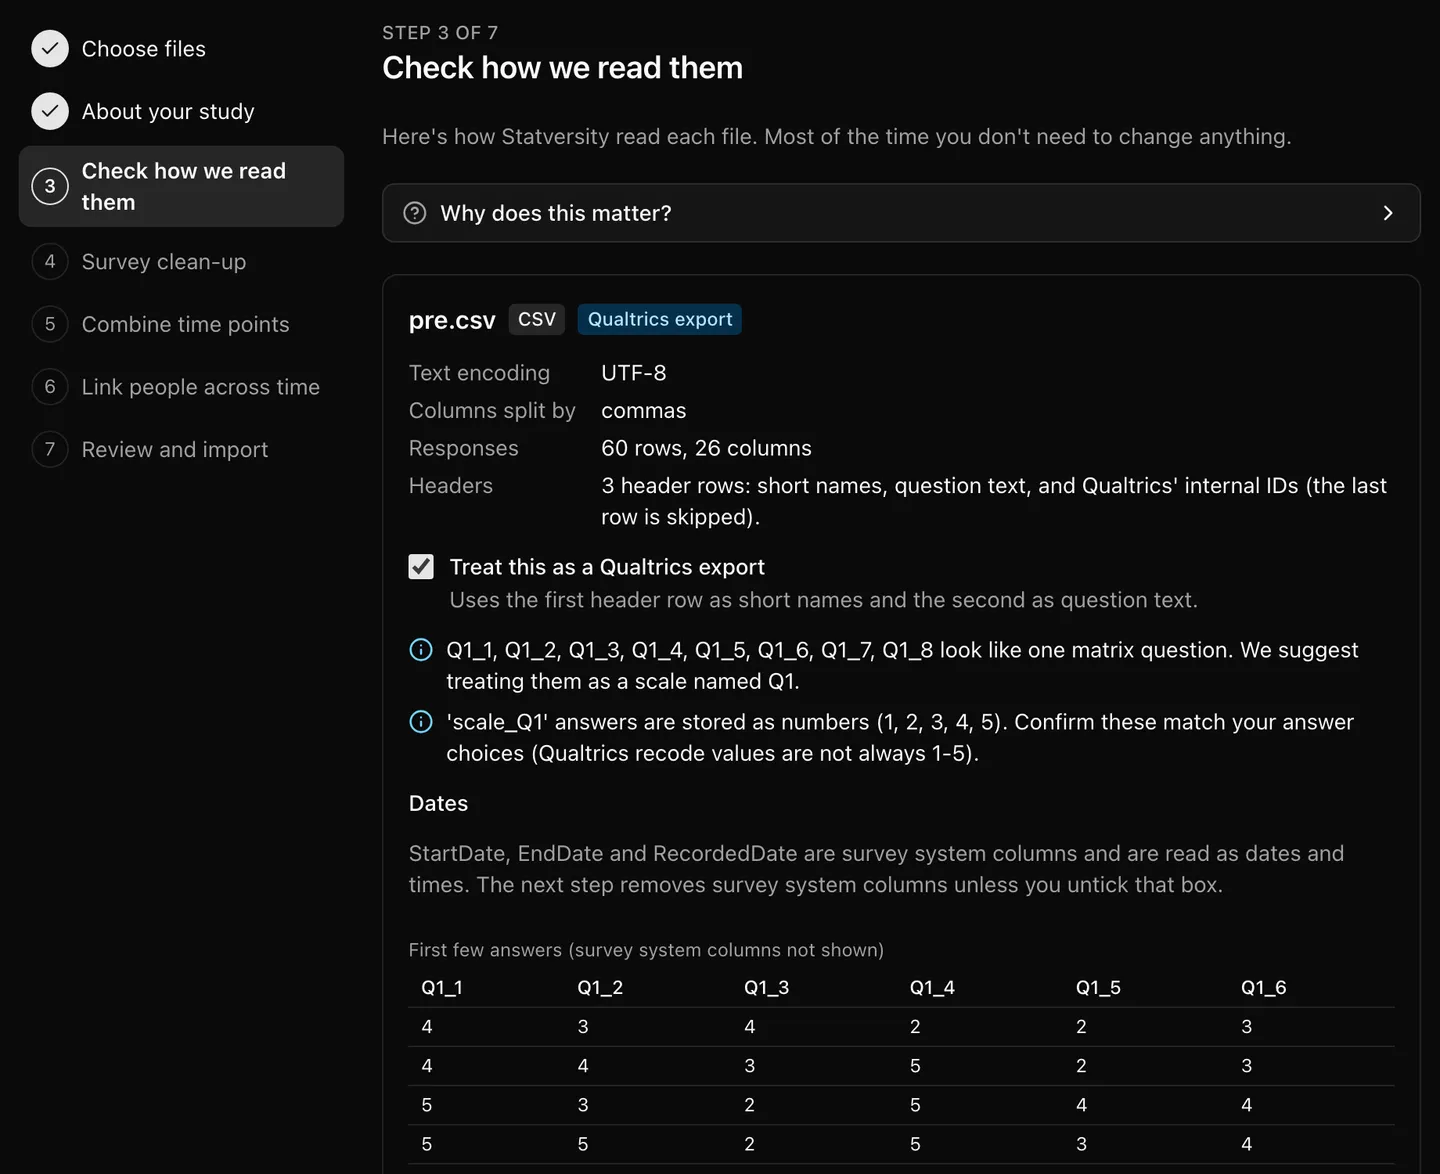
Surveys, test scores, grades, or program evaluations, anything you can put in a spreadsheet. Upload Qualtrics, Excel, CSV, SPSS, Stata or SAS files. Statversity notices the quirks of survey exports, such as extra header rows, and helps you tidy them.
Answer questions.
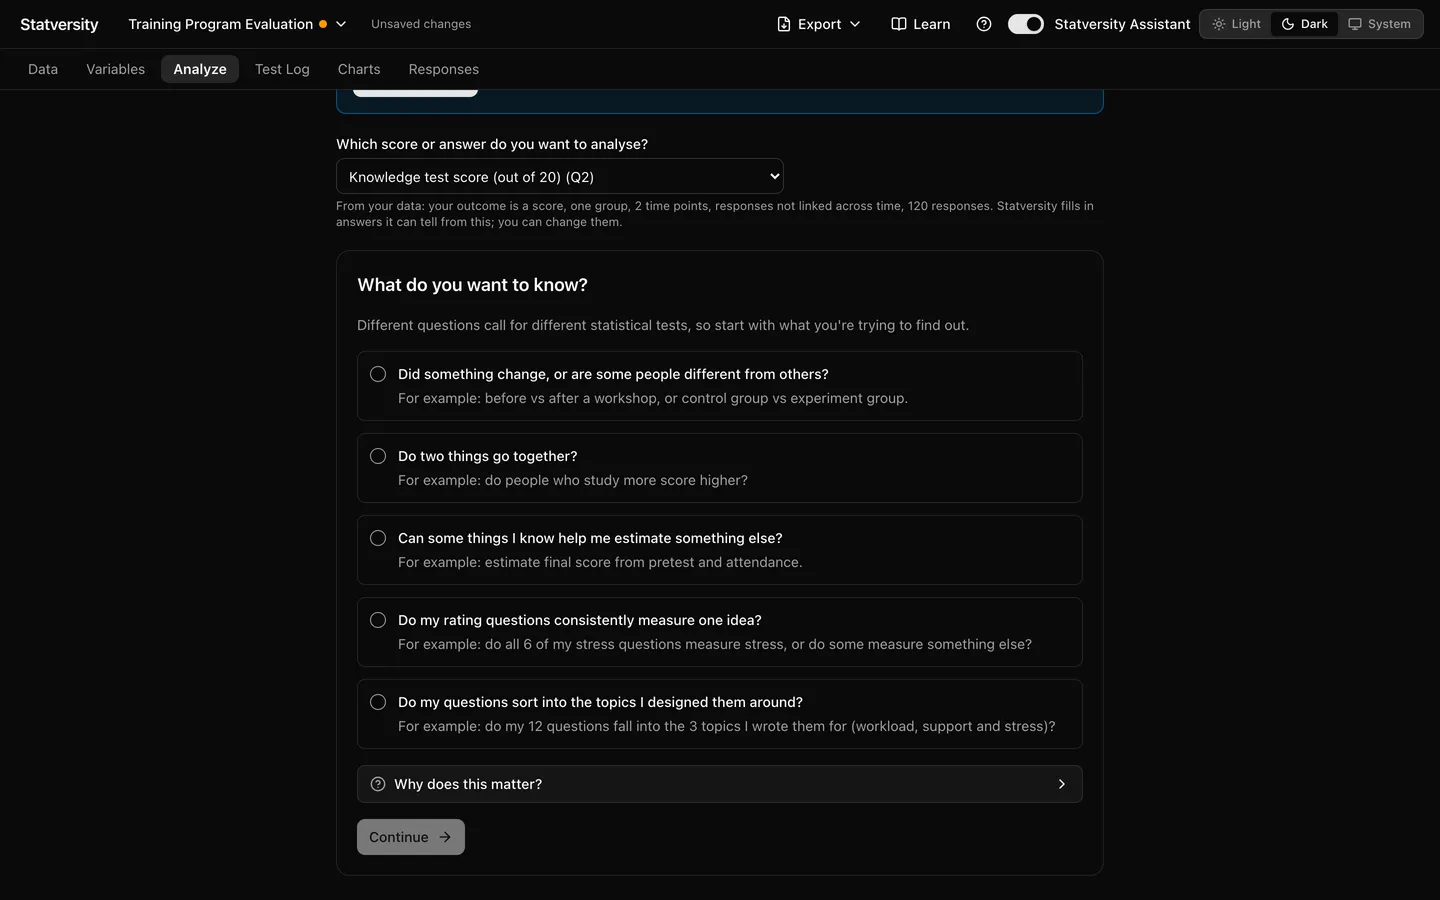
You don't have to memorize which tests to run for every research design. Answer questions like: Did the same people answer twice? Are you comparing groups? Then Test Advisor recommends a test and explains why.
Understand the results.
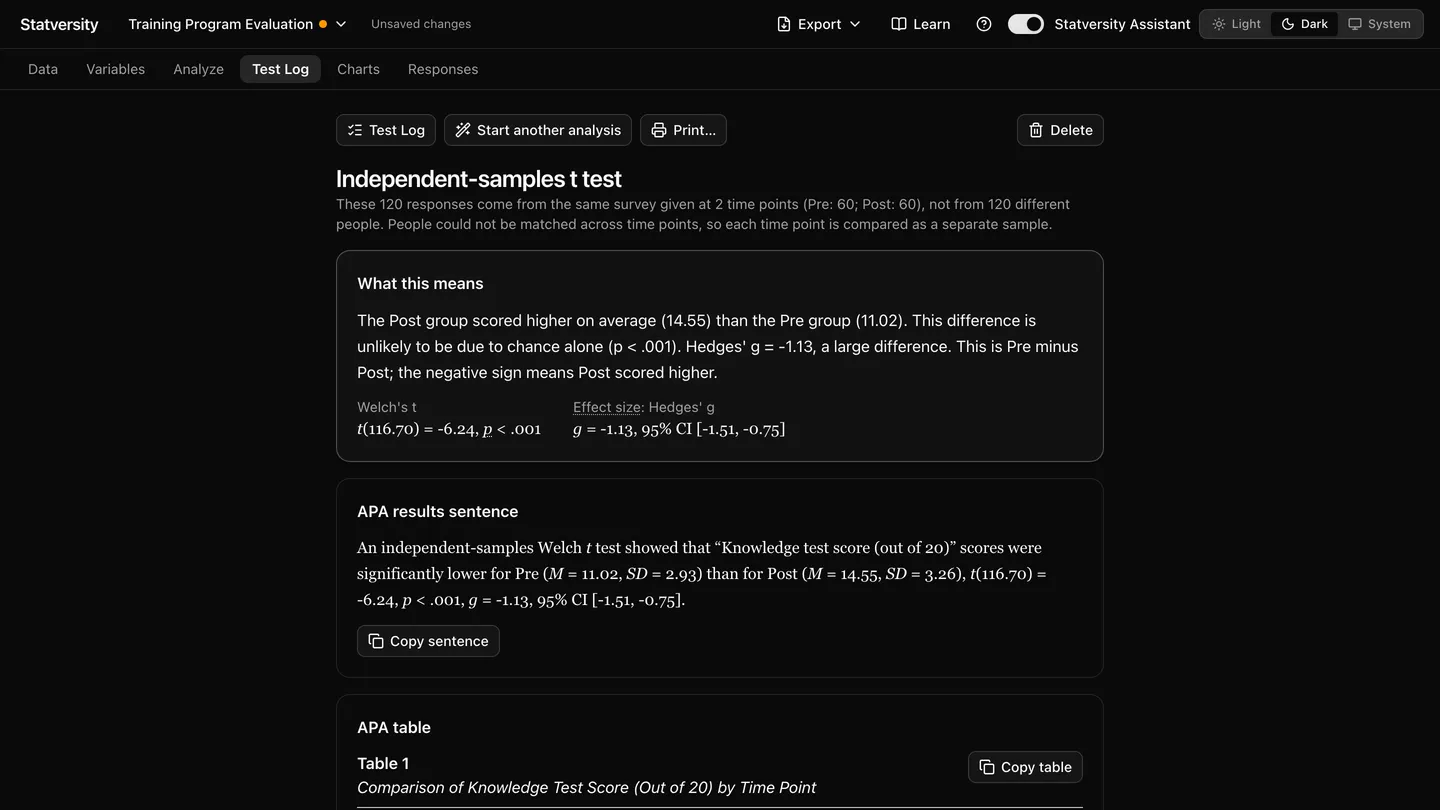
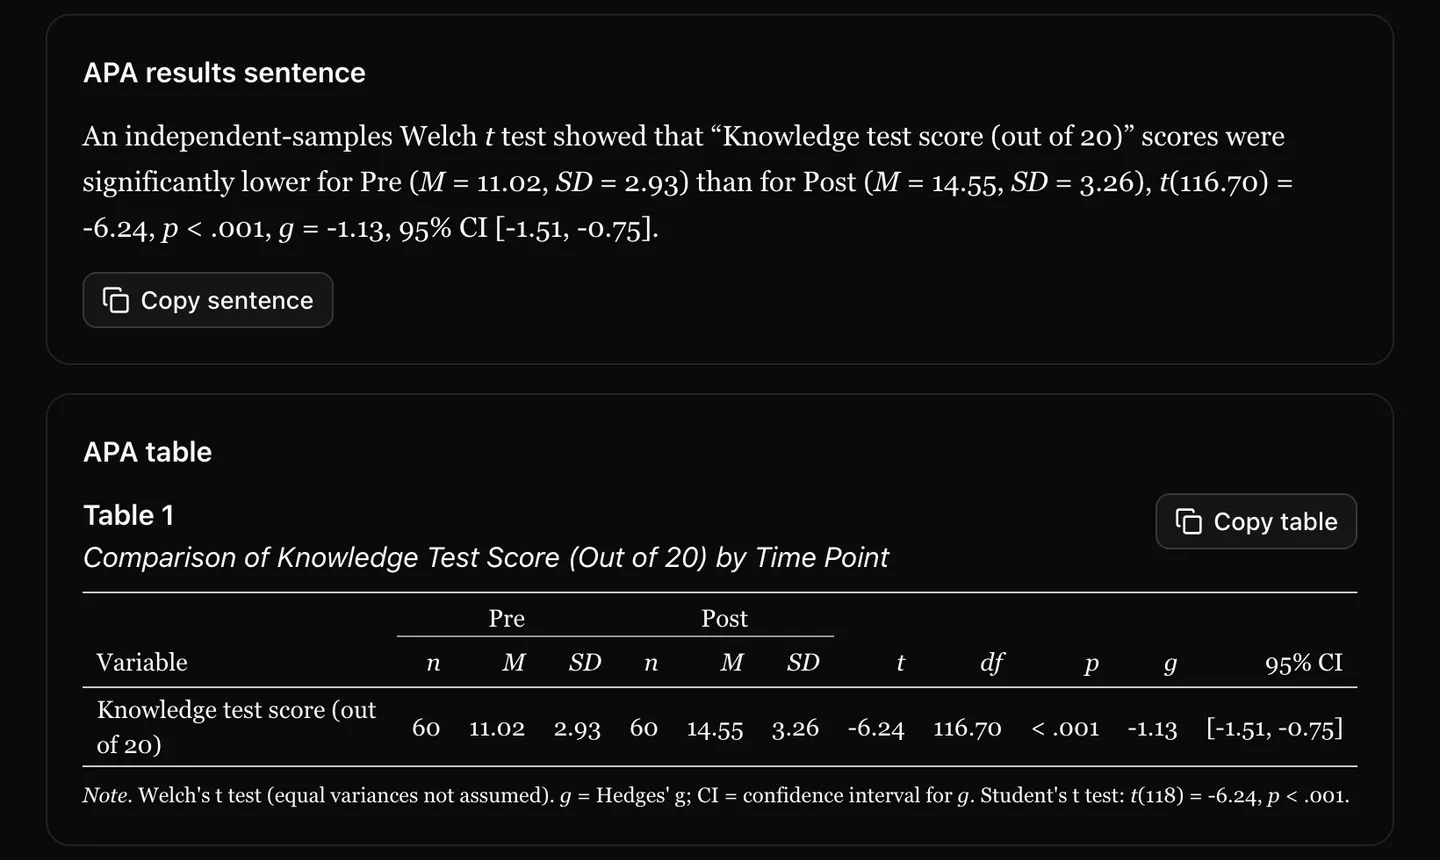
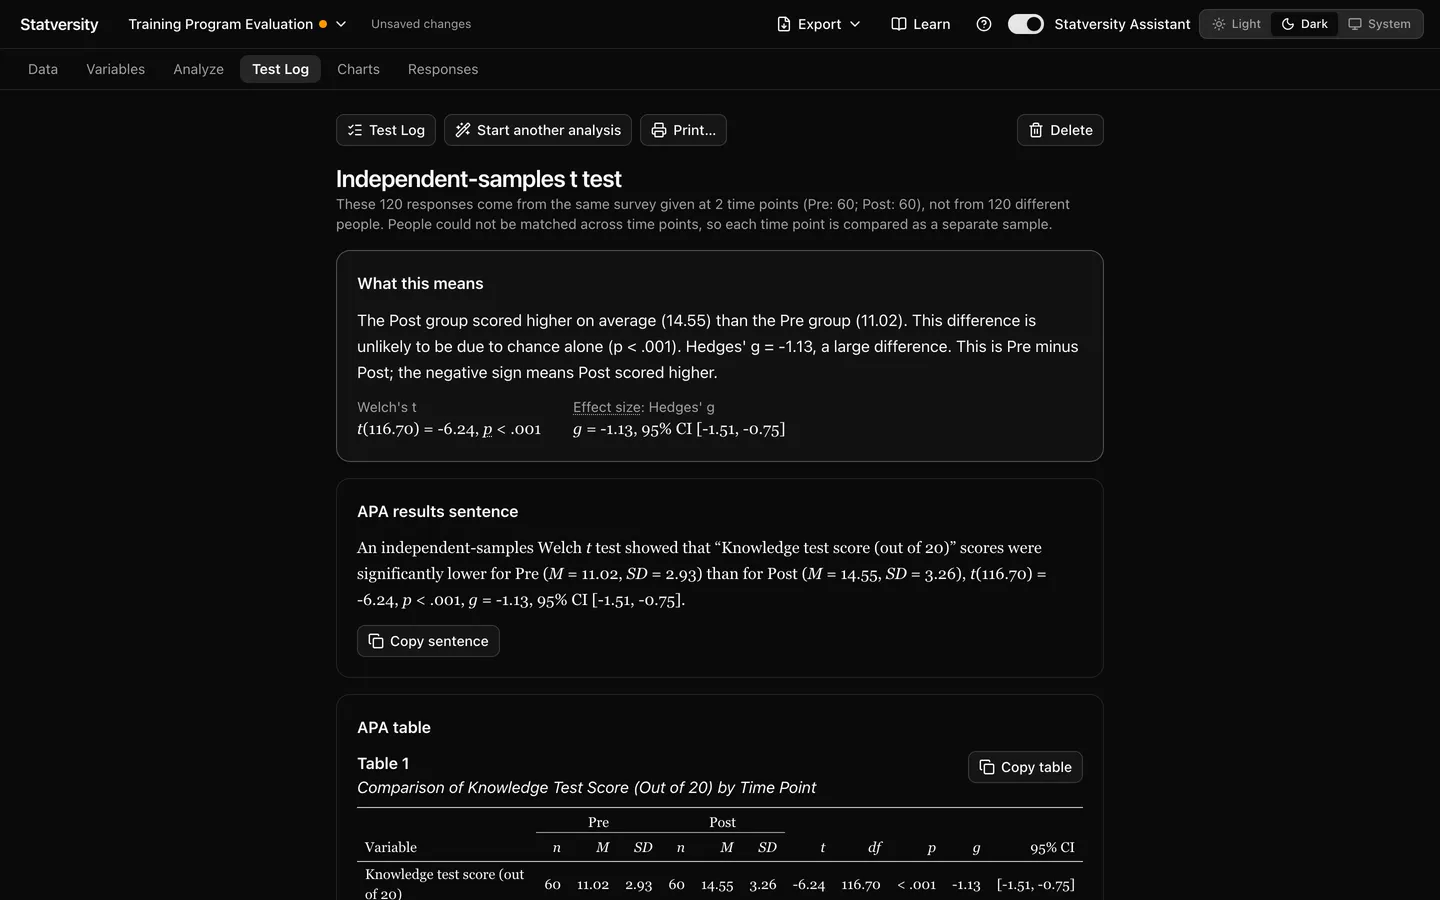
Every result comes twice: a plain paragraph that says what it means, and the same result in APA form with a sentence and a table you can immediately add to your document.
Statversity Key Features
An import wizard that knows survey exports.
Pick your files and Statversity reads them, confirms the headers, and offers immediate clean-up options including: drop the preview rows, hide system columns, combine time points, link the same people across files and much more.
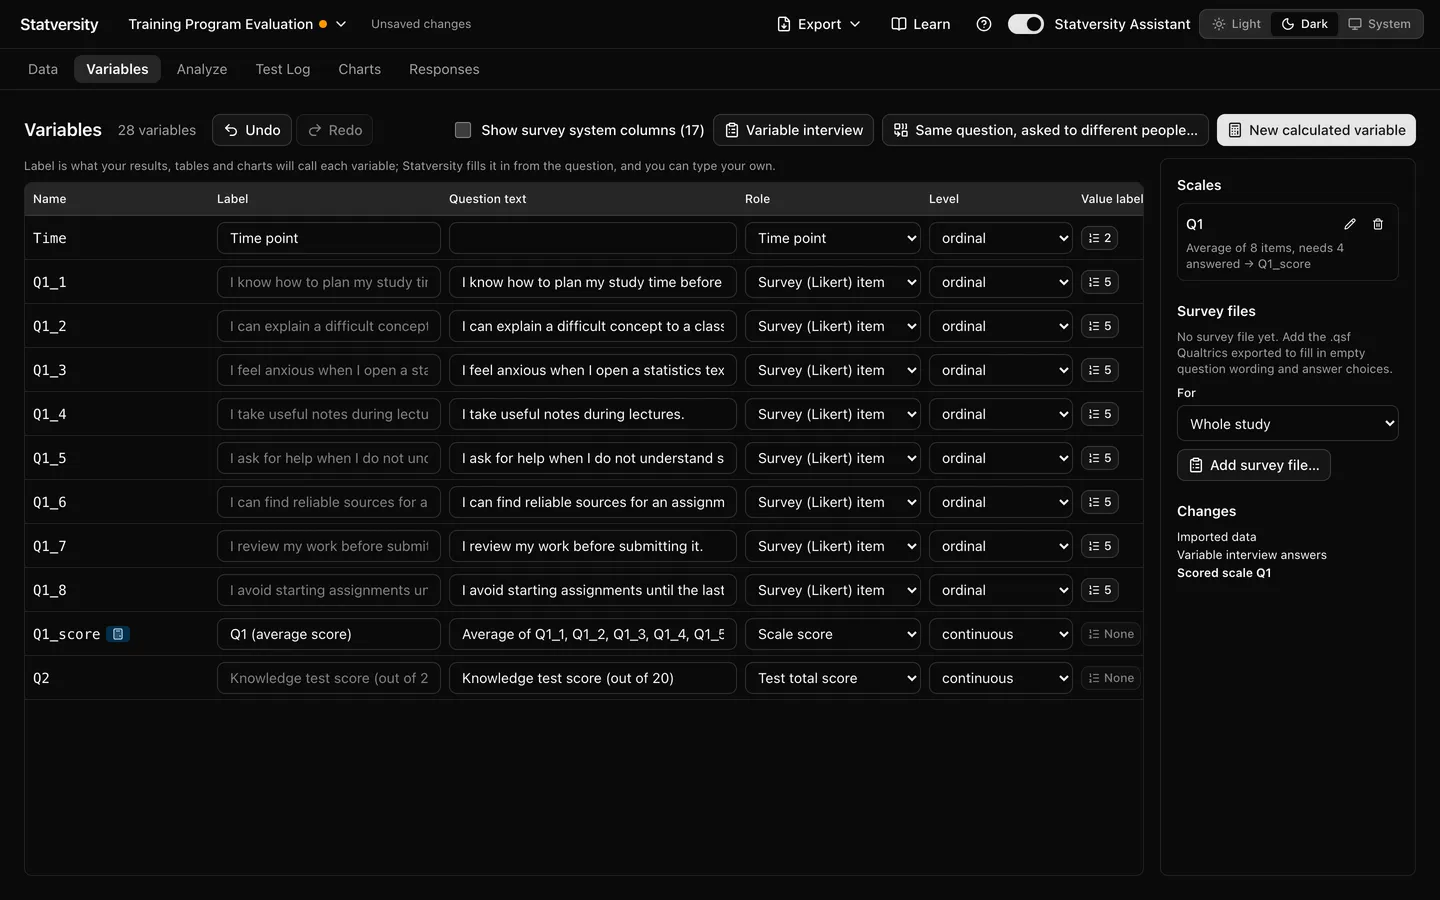
Your data as a table, and every column explained.
The Data tab is a spreadsheet you can edit, filter, de-duplicate and undo. The Variables tab explains each column including: an ID, a group, a test question, a rating. Quickly update value labels, build scales from related questions, and create new computed variables in one click.
Answer questions and the Test Advisor tells you what to run.
No test names needed. Answer plain questions about your study and the Test Advisor recommends an analysis, explains why, lists the assumptions to check, and names the backup test if necessary. Or if you want to set up all of the analyses for your data, ask the Study Planner to lay out a set of analyses at once.
What they mean, clearly explained.
Every result opens with a plain-English paragraph, followed by an APA sentence and table ready to copy into your paper, and then the assumption checks with their own plots. Each test gets the right chart automatically.
Design and build figures to explain your results.
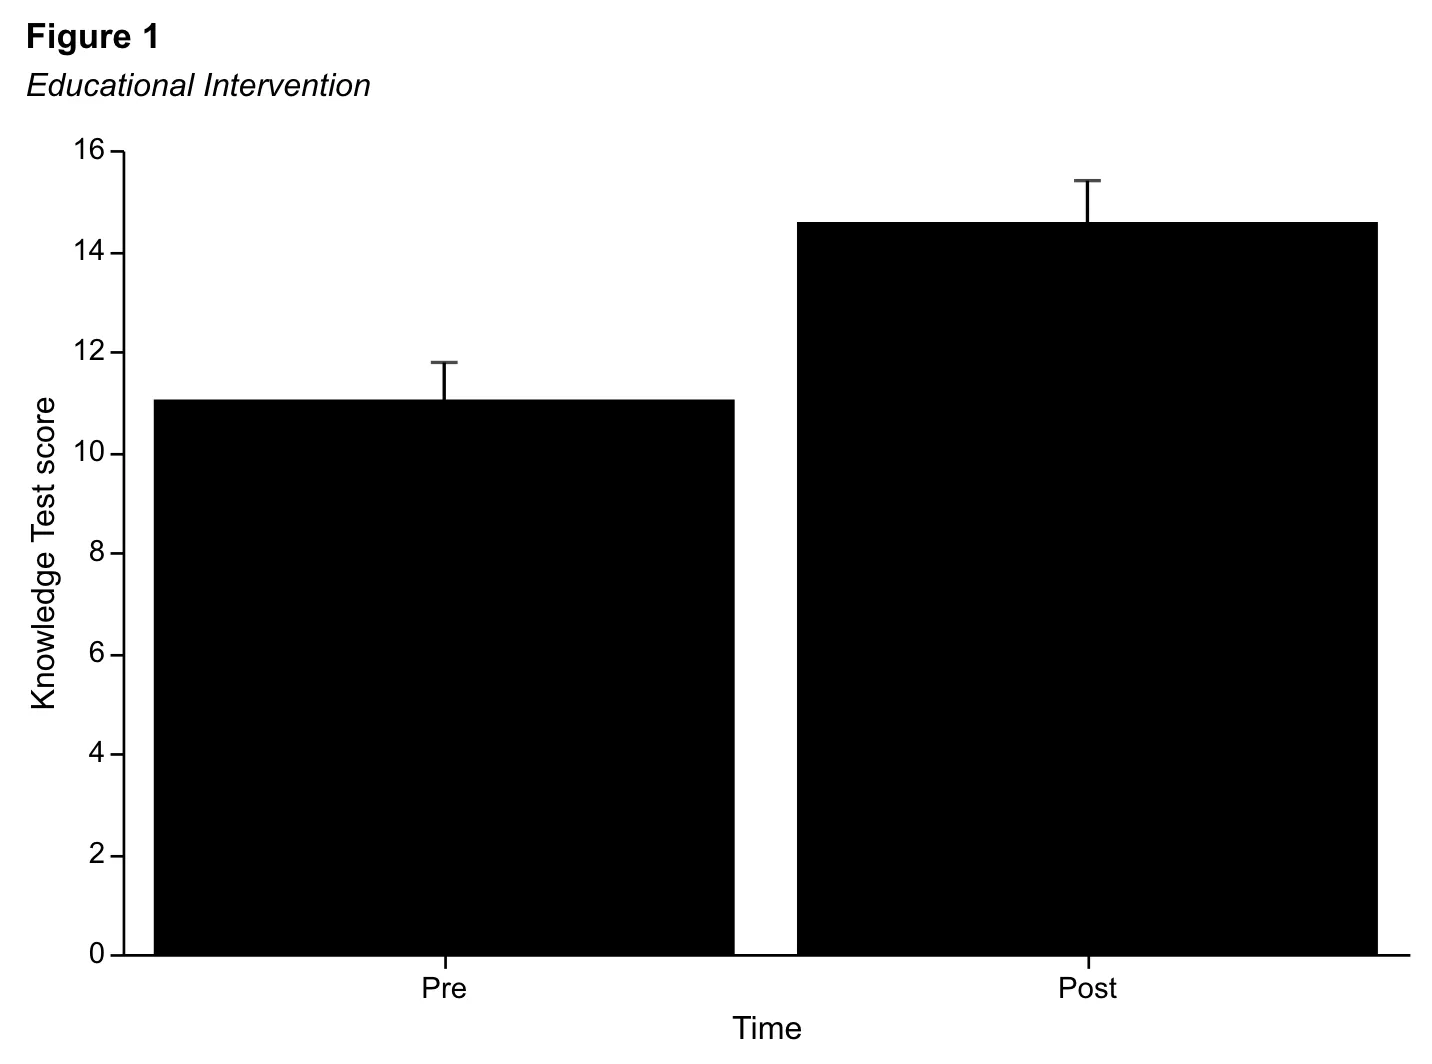
Chart builder offers 18 types of chart, an APA figure style in black and grey, colorblind-safe palettes, and export as PNG, SVG or PDF.
See all chart types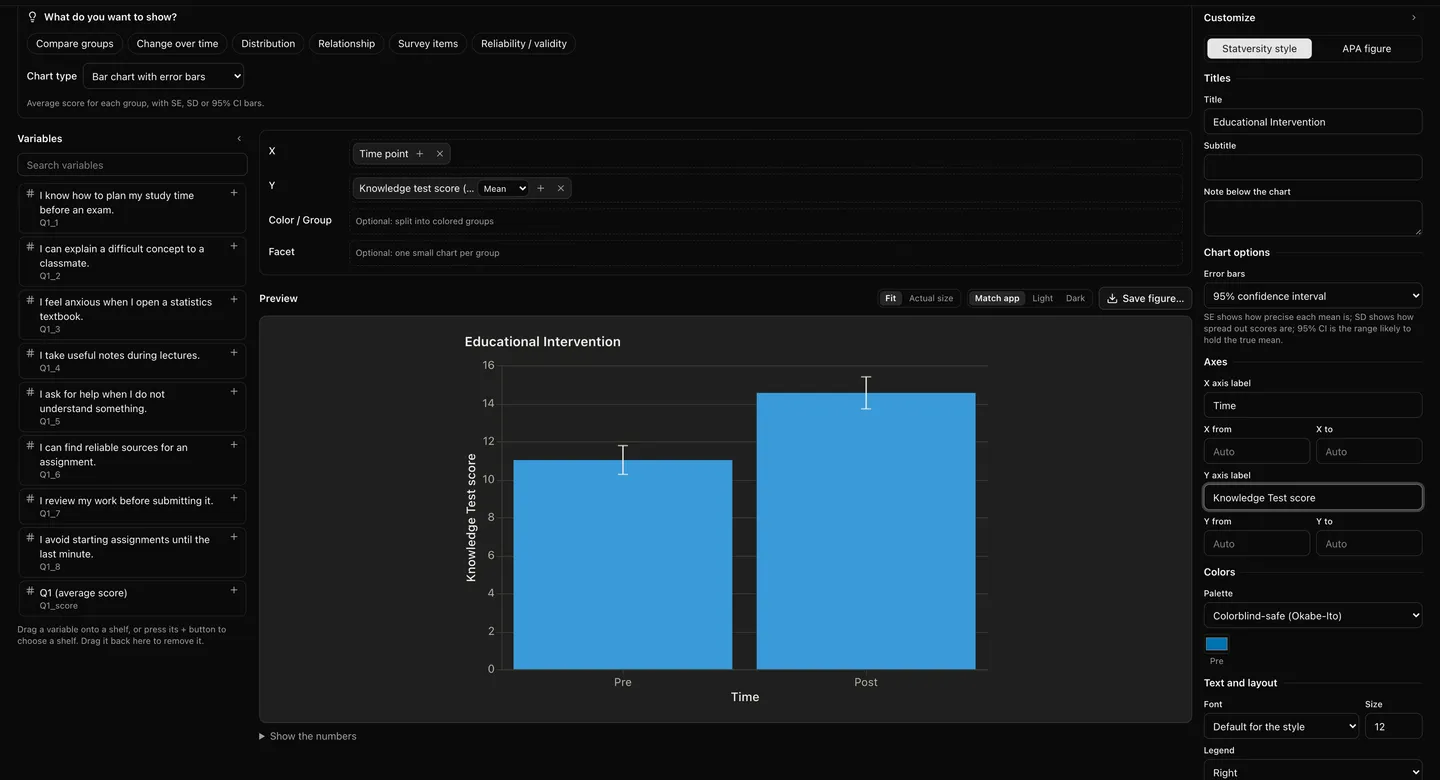
Statversity draws the figure for every test you run, and gives you a Chart builder for anything else you want to show. You choose what you want to say, Statversity suggests the chart, and the preview updates as you work.
Start from the question, not the chart type
Pick a goal and the builder suggests suitable chart types. A goal never locks you in.
- Compare groups
- Change over time
- Distribution
- Relationship
- Survey items
- Reliability / validity
18 chart types
Compare and change
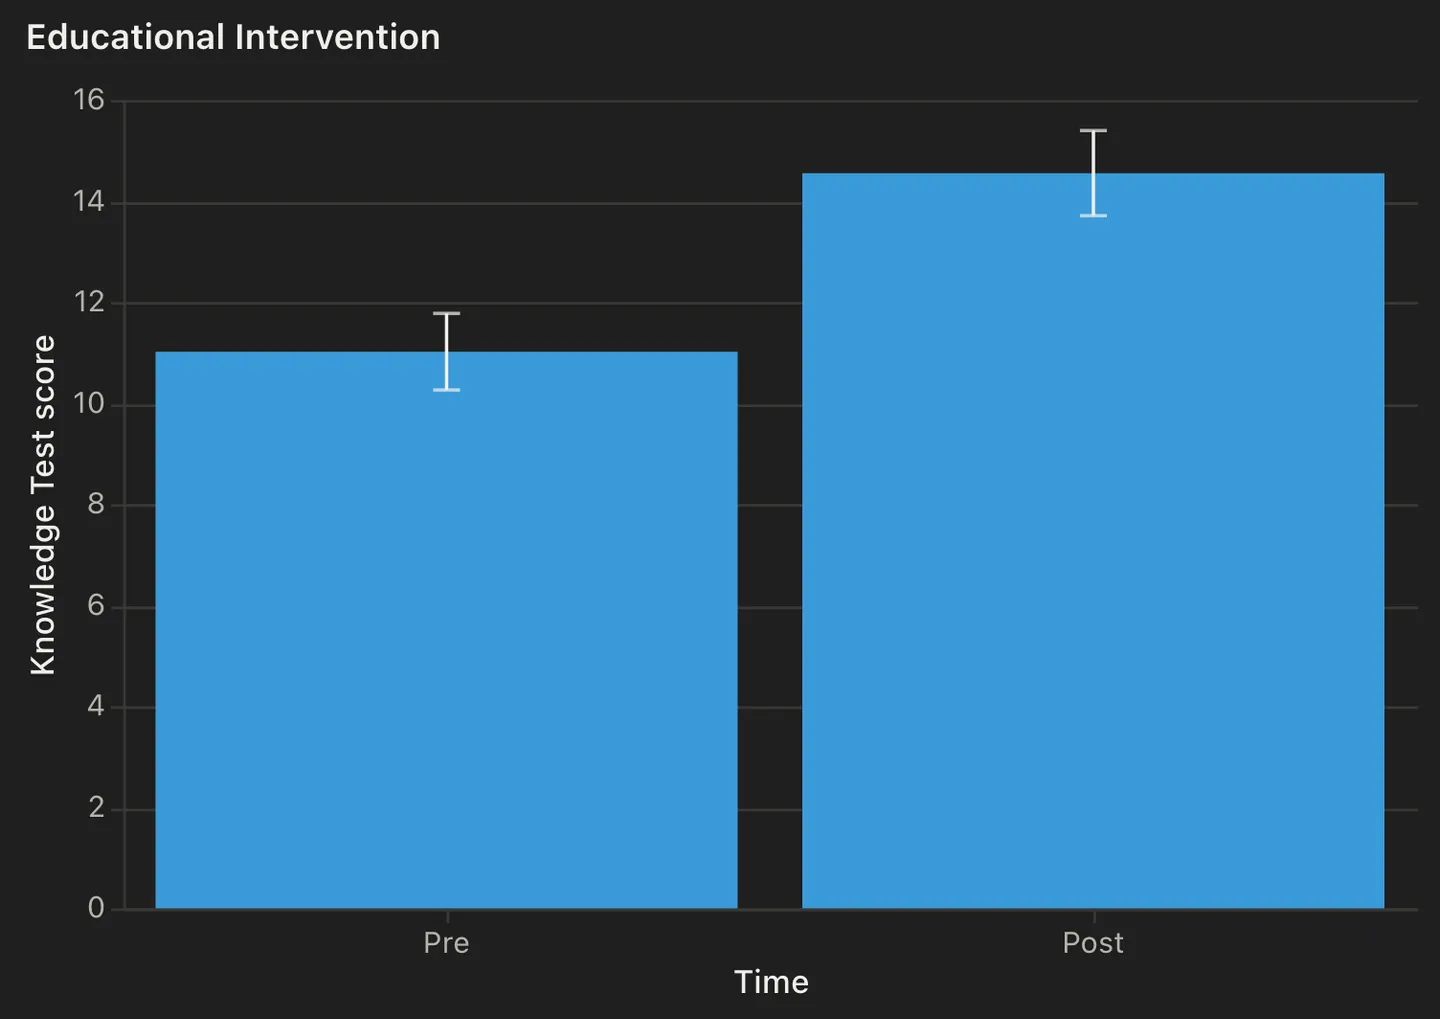
- Bar chart with error bars
- Grouped bar chart
- Line chart over time
- Interaction plot
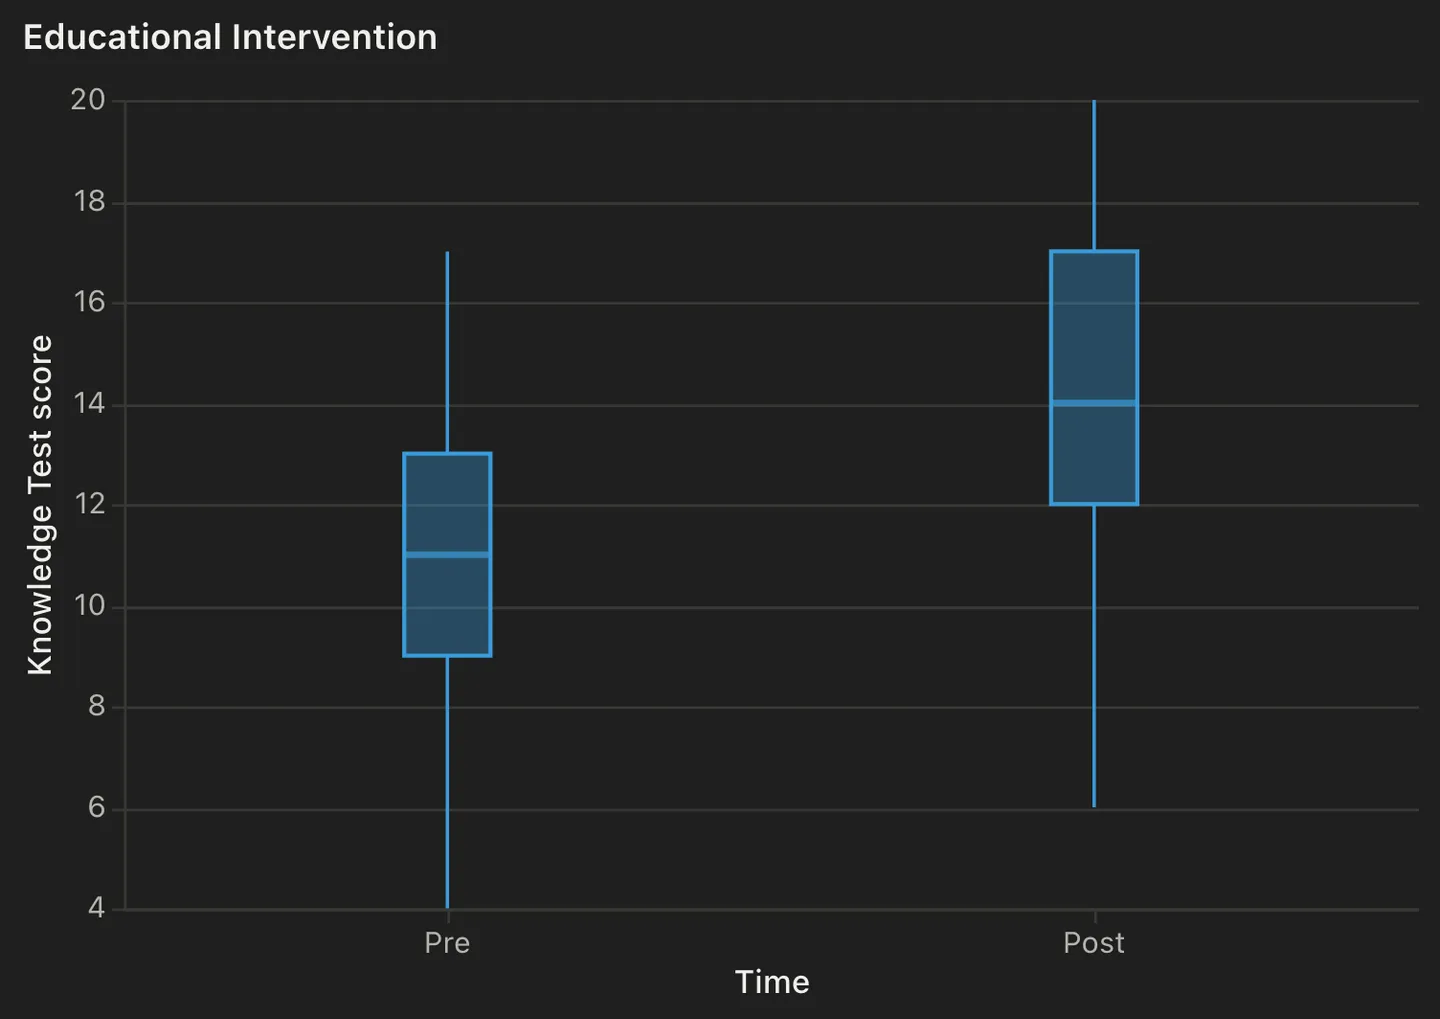
- Box plot
- Violin plot
Distribution and relationship
- Histogram
- Density plot
- Q-Q plot
- Scatter plot with fit line
- Correlation heatmap
Survey items
- Likert diverging bars
- Stacked bar chart
- Percent (100%) bar chart
From a saved analysis
- Scree plot
- CFA path diagram
- Interaction plot (moderation)
- Mediation path diagram
Gallery
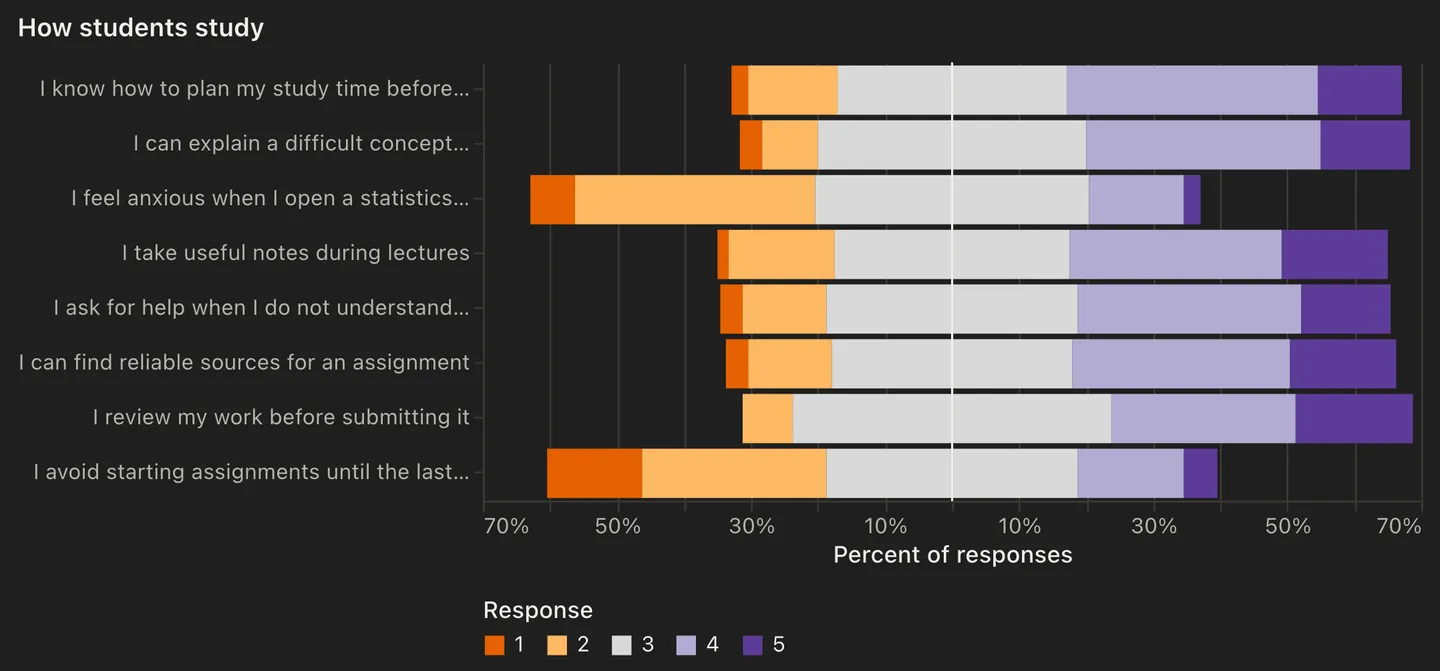
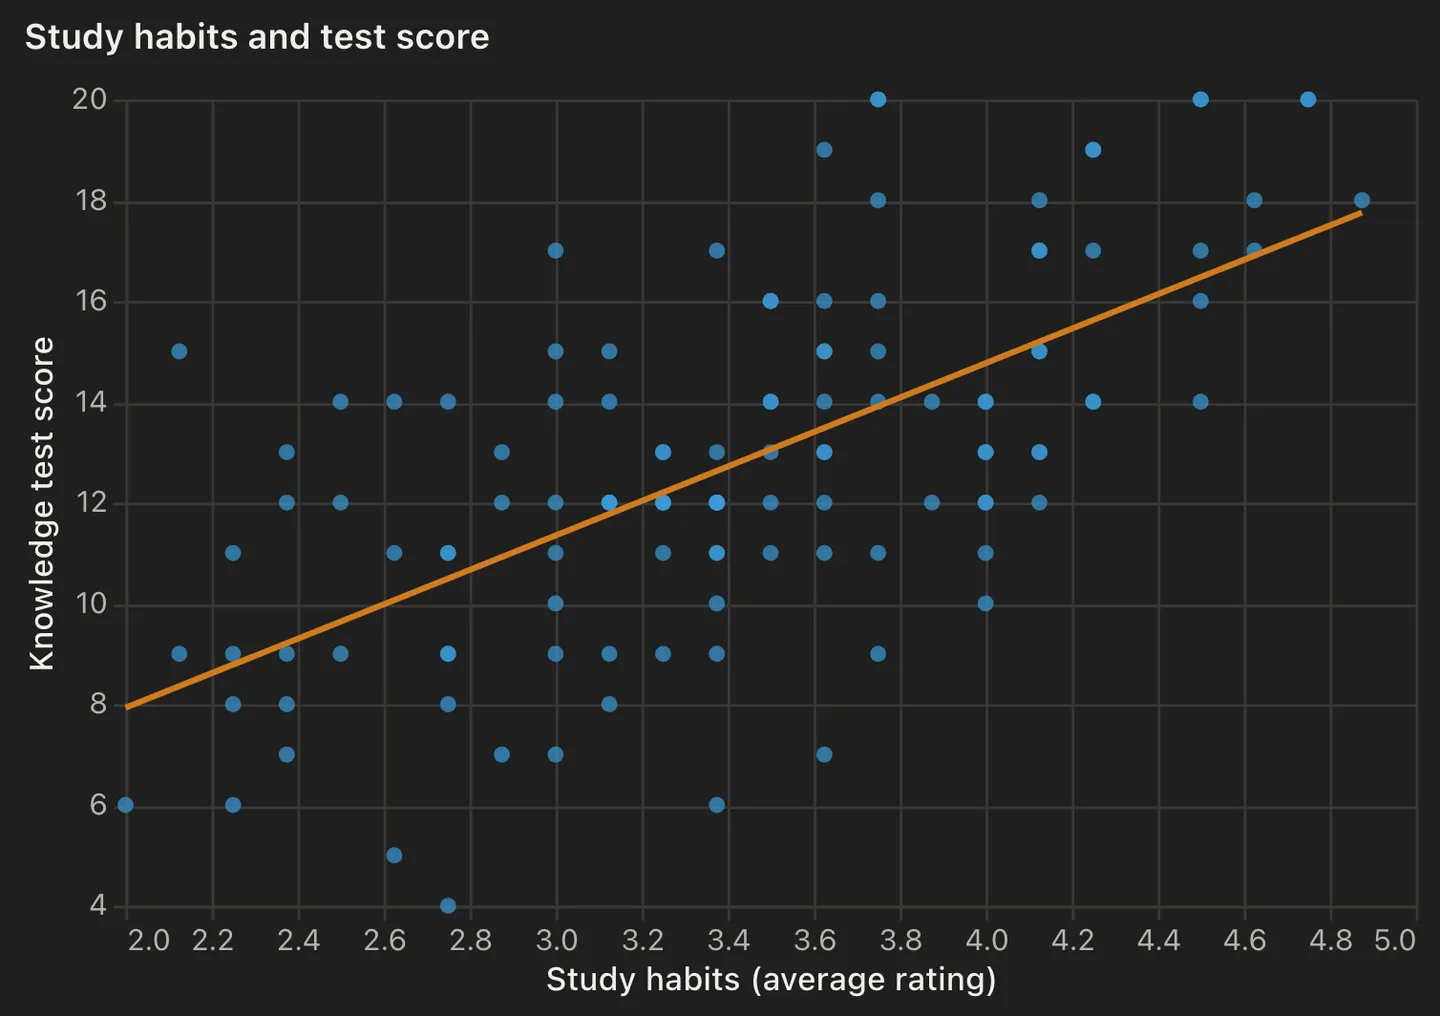
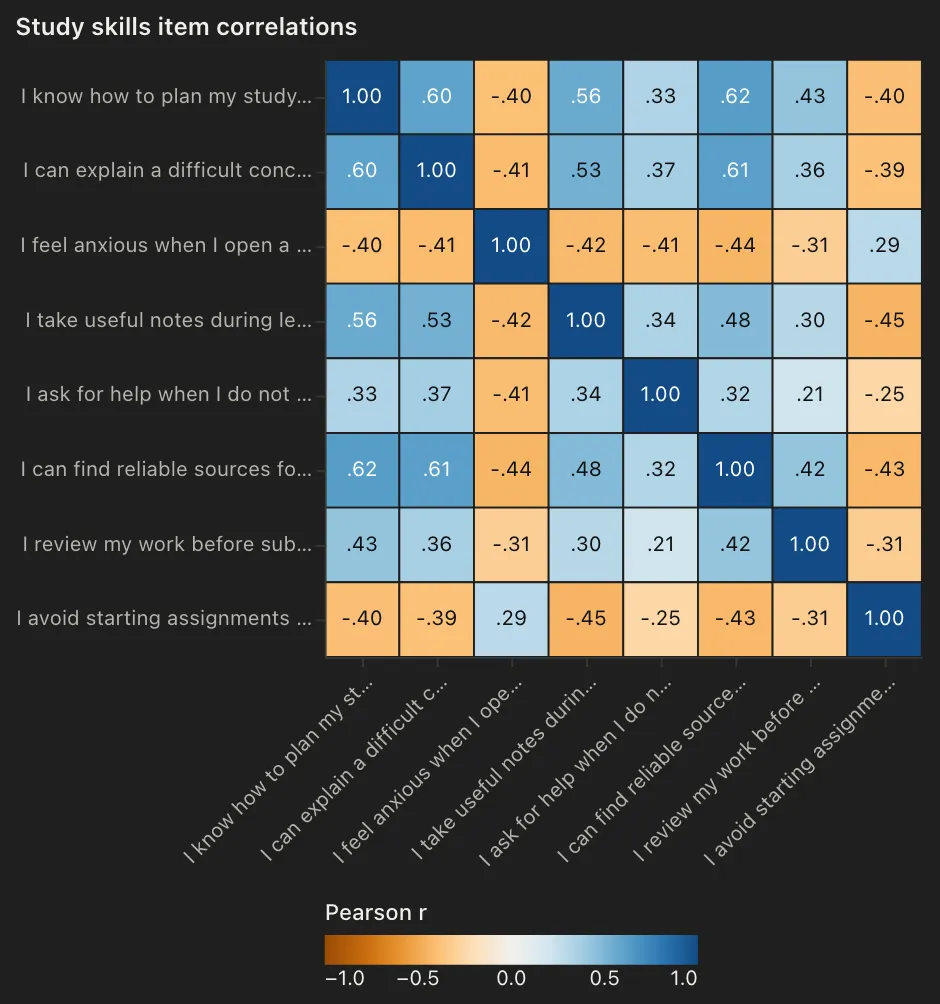
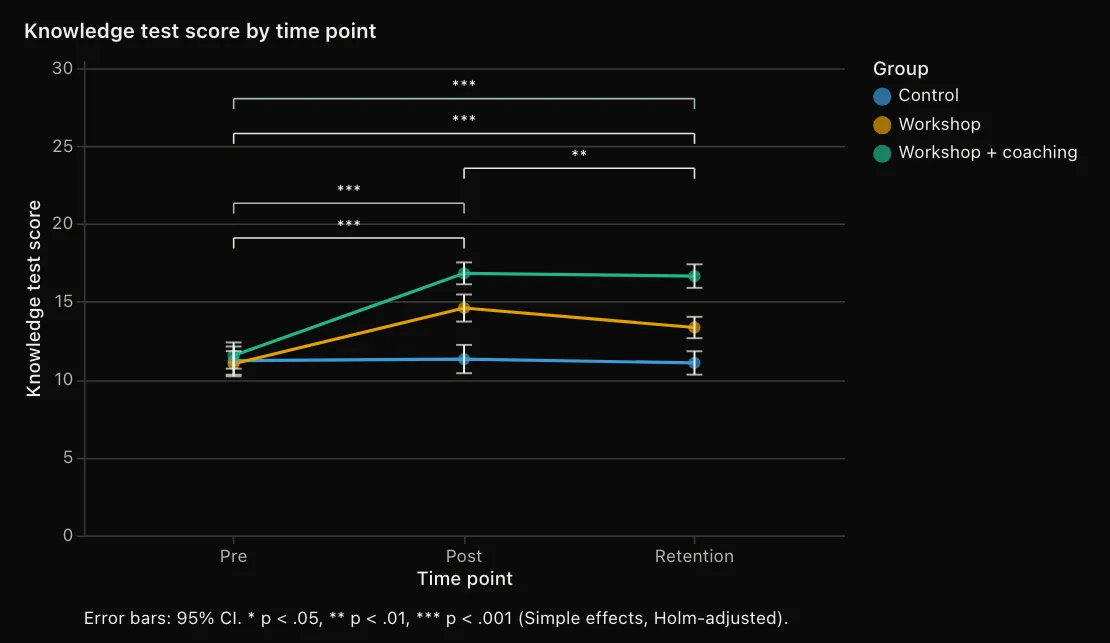
Made for publication
APA figure style
One click switches to black, grey and simple, with figure number, italic title and note laid out the APA way.
Colorblind-safe palettes
Okabe-Ito and Tol bright palettes, black and greys, or your own colors.
Error bars you choose
95% confidence interval, standard error, standard deviation, or none. The note can say which.
Fonts and sizes
Arial, Helvetica, Calibri, Georgia or Times New Roman, and any width and height in pixels.
Export
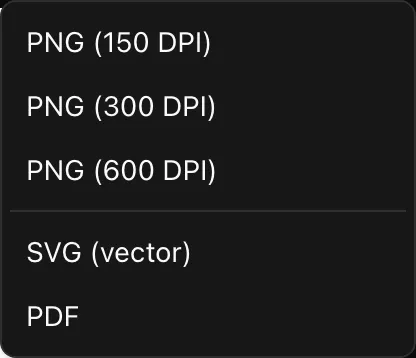
PNG at three sizes and DPI, SVG for vector editing, or PDF.
Show the numbers
Every chart can expand a table of the plotted values.
Every result already has a chart
Each Results page shows the right figure for the test: means with error bars, box plots, Q-Q plots and histograms for assumption checks, scatter plots with fit lines. Click Edit chart to restyle it with the same options, and the exported report uses your version.
A record of every analysis you ran, ready to be exported.
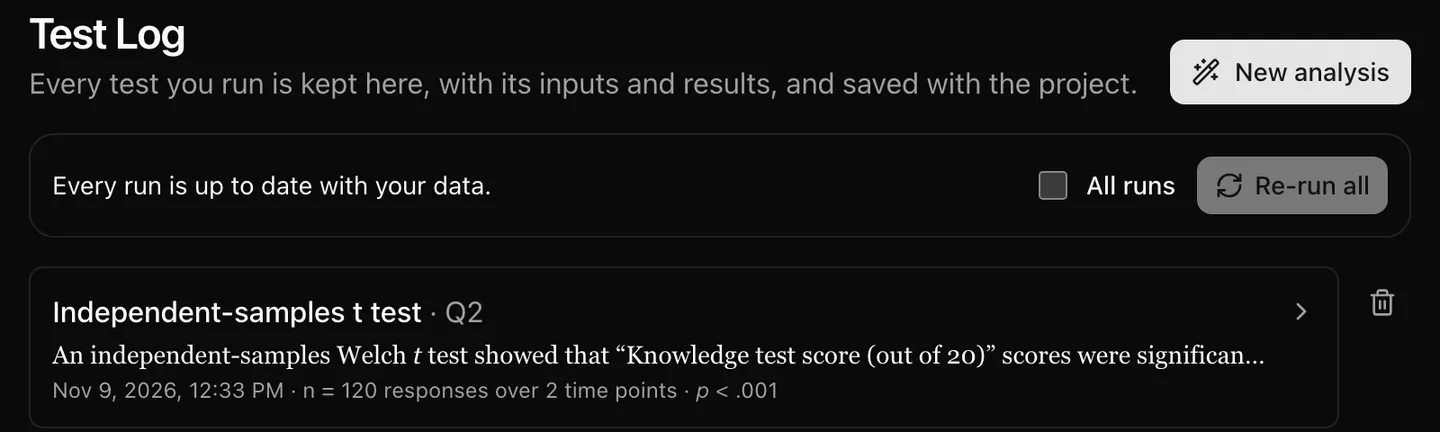
The Test Log keeps every analysis with its settings and results, so you can show exactly what you did. Export the data to Excel, CSV, SPSS or Stata, and the results as a Word doc or PDF report with your charts.
Everything a study needs, without the code.
More than 60 analyses you can trust
From t tests and ANOVA to regression, reliability, factor and power analyses, built on the same open-source statistical libraries used in published research.
More
T tests, one-way, factorial, repeated-measures and mixed ANOVA, ANCOVA, MANOVA, chi-square, nonparametric tests, correlation, linear, logistic, ordinal and hierarchical regression, mediation and moderation, reliability (Cronbach's alpha, McDonald's omega, KR-20, ICC, kappa), factor analysis (EFA and CFA), post hoc tests and power calculators. Every calculation runs on your own computer using SciPy and statsmodels, the open-source libraries behind thousands of published studies.
Scales and reliability
Combine related questions into a score, flip reverse-worded items, and check whether a questionnaire measures one idea.
More
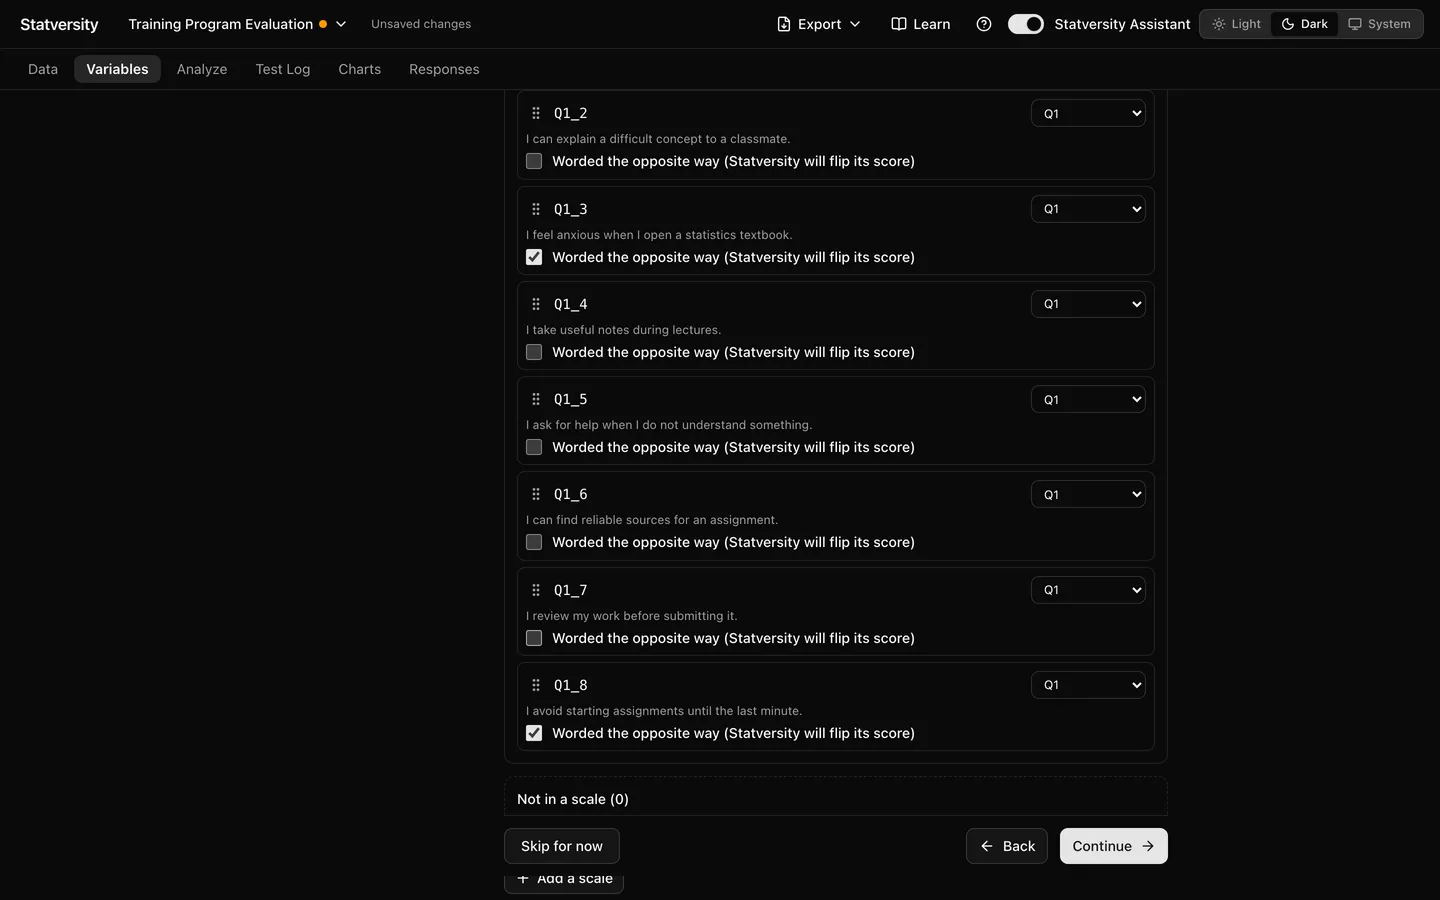
Group related questions into a scale, mark reverse-worded items so they count the right way, and get Cronbach's alpha and McDonald's omega with a plain explanation of whether the scale holds together.
Pre-and-Post studies
Match the same students across time points, compute gain scores, and compare groups.
More
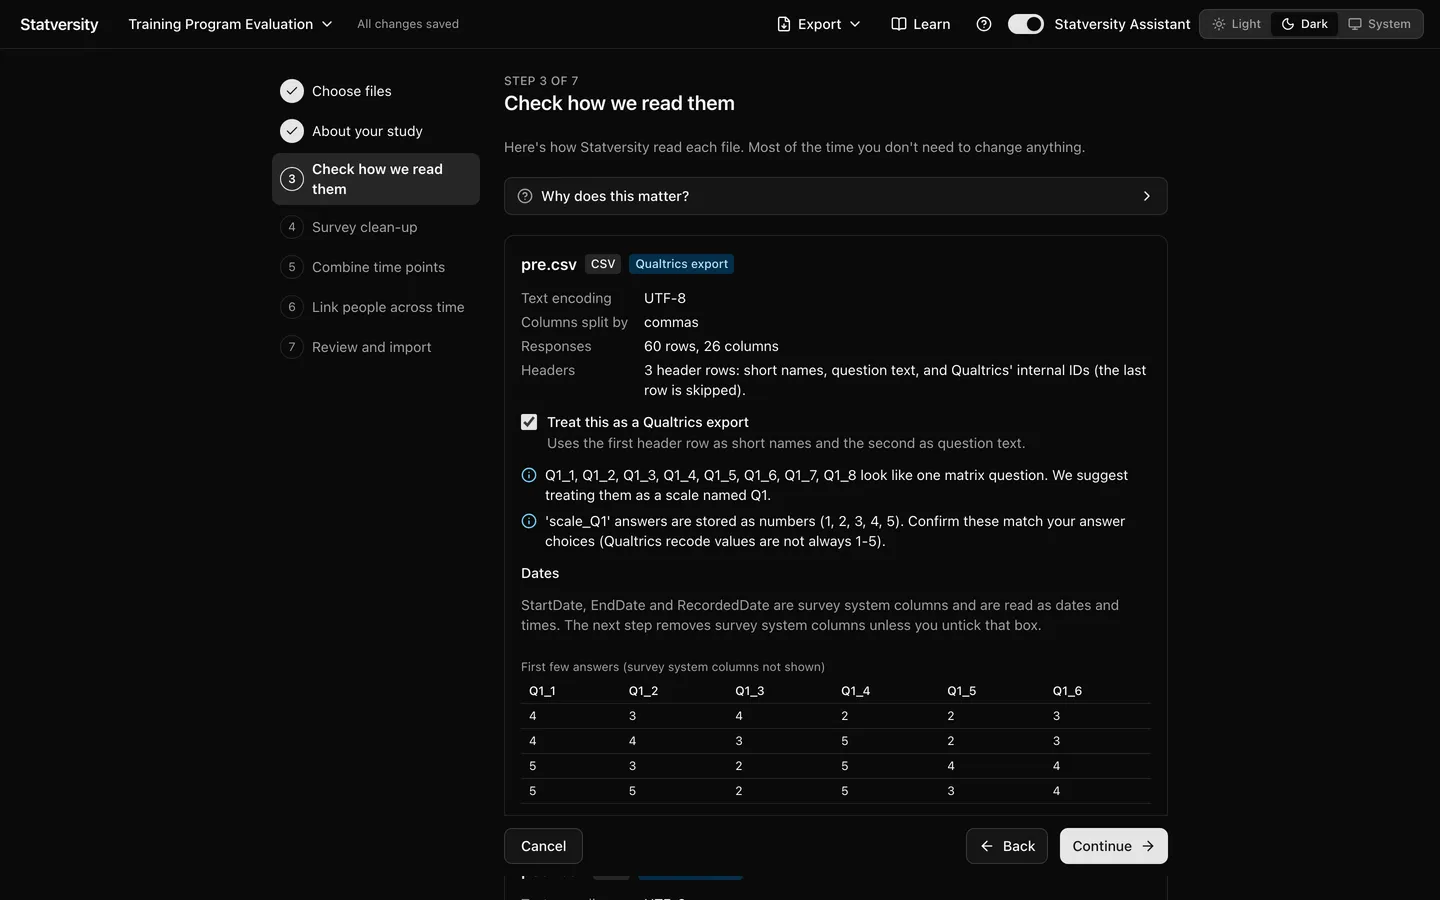
Load a pre and a post file, link the same people by ID or by matching answers, and compare change over time with the right paired or mixed test.
Yes/no and knowledge questions
Score test items with right answers and work with yes/no data without recoding by hand.
More
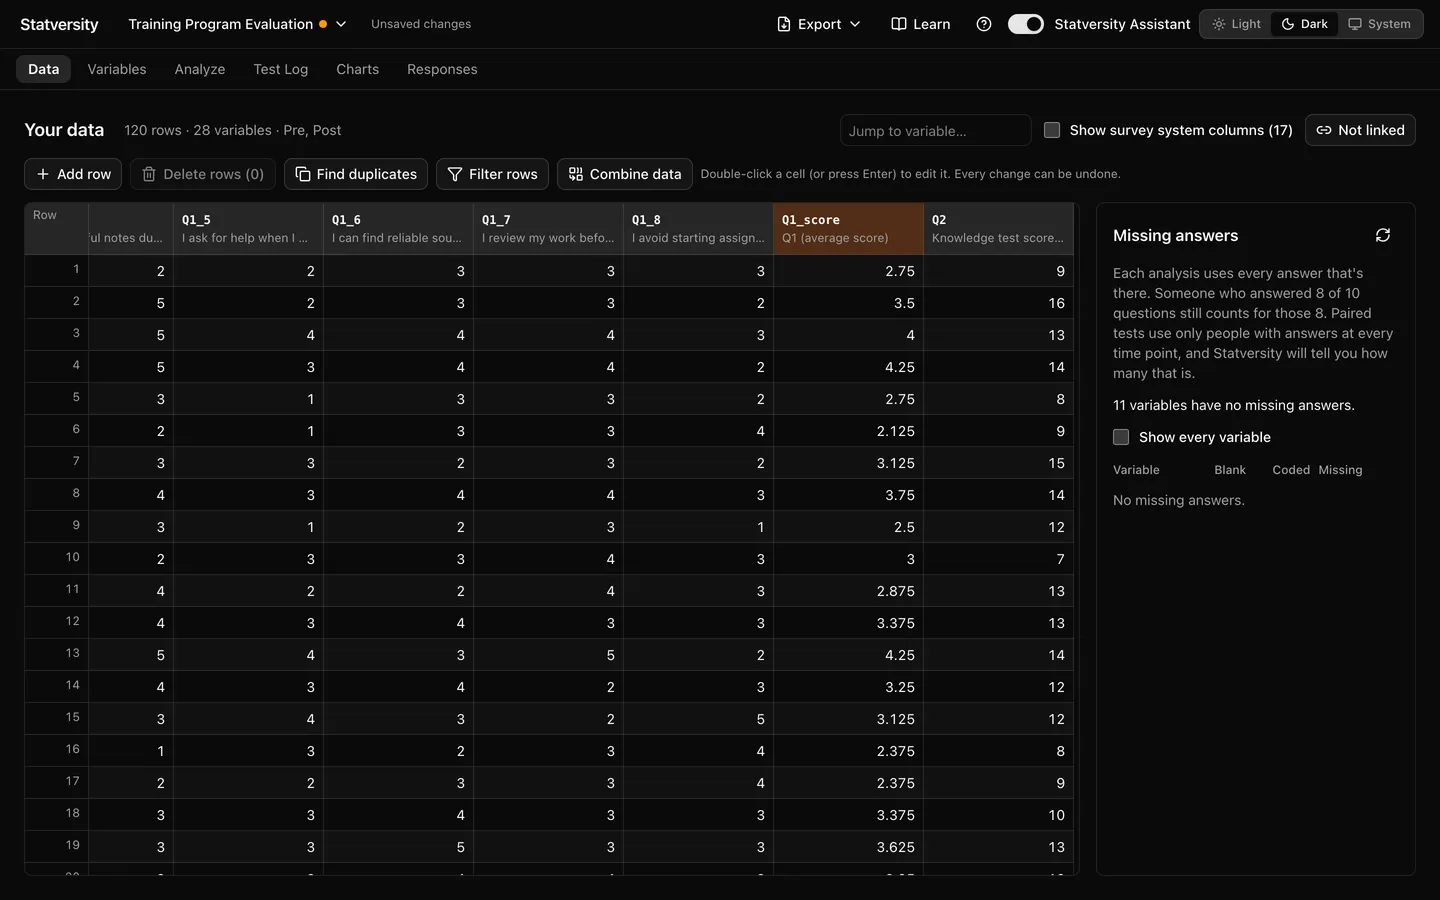
Mark the right answer for each test item and Statversity scores it. Yes/no data gets its own tests, like McNemar and Cochran's Q, without recoding by hand.
Survey flow
See how a branching survey sends people down different paths, so you know why some answers are blank.
More
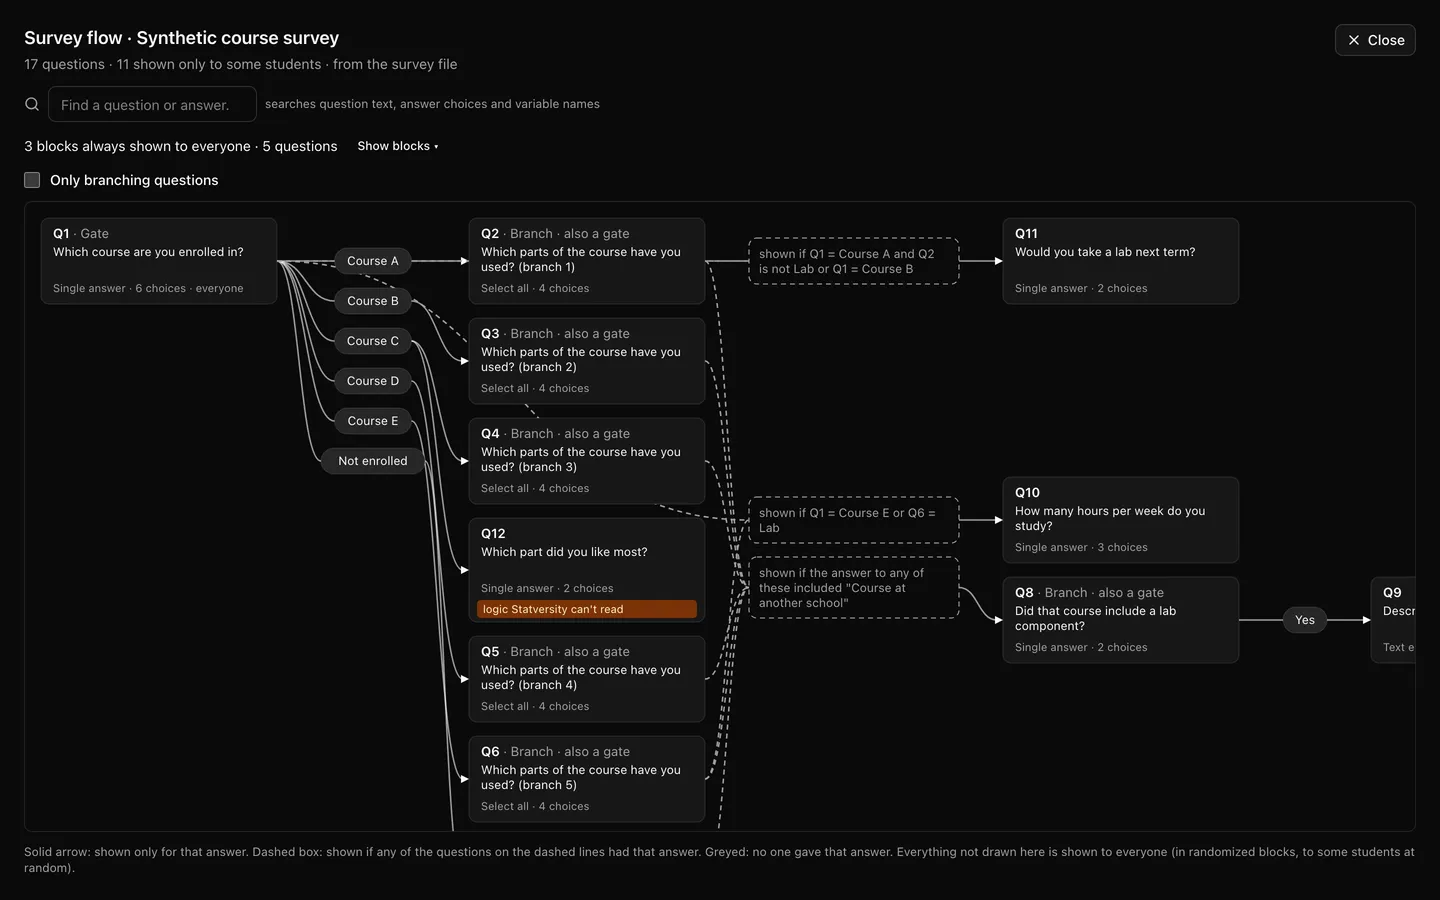
Give Statversity your Qualtrics survey file (.qsf) and it reads the display logic: which questions each person was shown, and which were skipped on purpose. The flow view draws the branches, you can search for any question, and a blank answer is labelled as not shown rather than counted as missing. That keeps your sample sizes honest and stops a skip pattern from looking like a data problem.
Everything is a teaching moment
Each screen explains what it is asking and gives an example. Turn the Assistant off when you no longer need it.
More
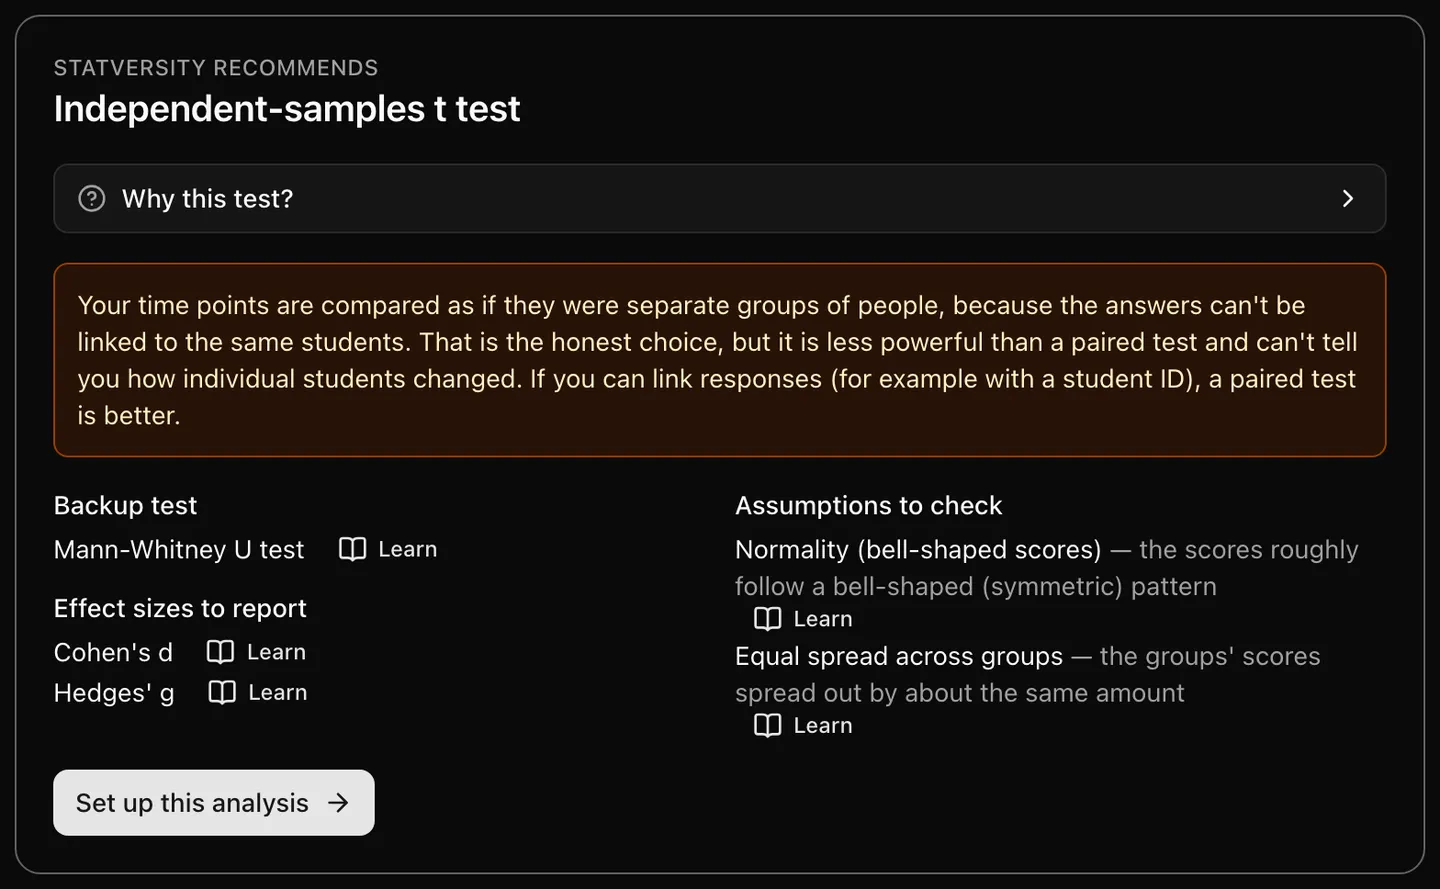
The Test Advisor does not just name a test. It tells you why that test fits your design, which backup test to use if an assumption fails, which effect sizes to report, and which follow-up tests come next, each with a Learn link that explains the idea in plain words. You finish the analysis knowing what you ran and why, which is exactly what a committee or reviewer will ask.
Durations and dates
Work with time spent, days between events, and dates without converting them by hand.
More
Dates and times are everywhere in research data: when a student enrolled, when a test was taken, how long someone spent on a task. Statversity recognises these columns when you import, and turns them into numbers you can analyse: minutes spent, days between two events, or results grouped by month. No spreadsheet formulas and no converting by hand.
Export for your paper
Word, Excel, CSV, SPSS or Stata. Charts included.
More
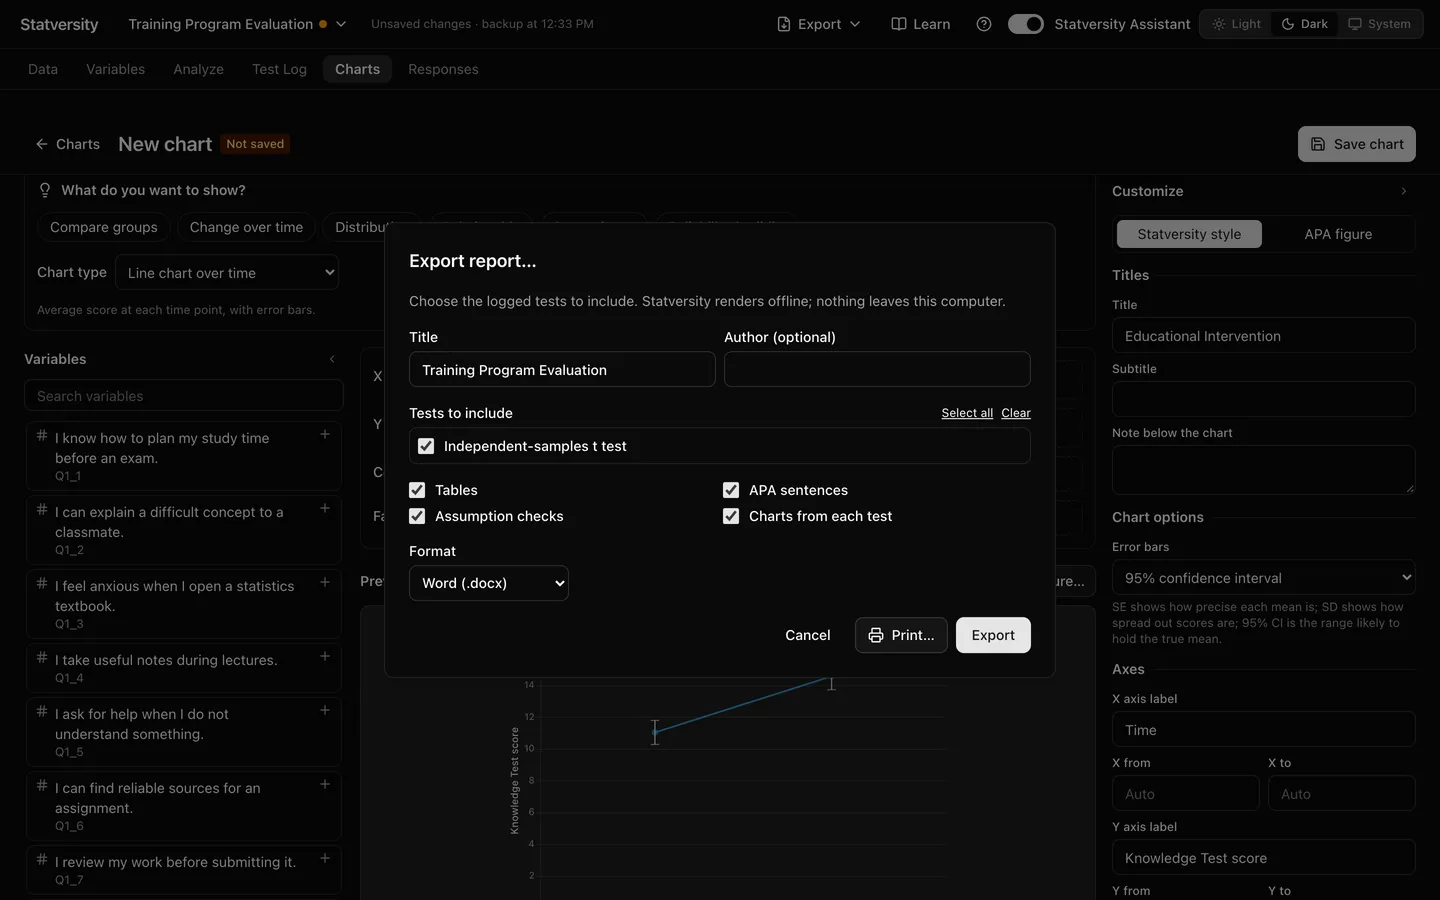
Word report with APA tables and figures, or the data as Excel, CSV, SPSS or Stata. Charts export as PNG, SVG or PDF.
Built for people with a deadline.
Graduate students writing a thesis or dissertation. Faculty and staff running program evaluations. Teachers comparing classes or checking whether a change worked. Anyone with data and a question who does not have a statistics course fresh in their mind. If you can open a spreadsheet, you can use Statversity.
$29.99, once. Every future version included.
One payment of $29.99, every future version included.